Tools
Table of content - click on an item below to see more
Tracking chromatin looping using Super-Resolution Live-Cell Imaging
Spot-On
Quantifying absolute protein abundances (# proteins/cell)
Anisotropy
Microfluidics
Tracking chromatin looping using Super-Resolution Live-Cell Imaging
Spot-On
Quantifying absolute protein abundances (# proteins/cell)
Anisotropy
Microfluidics
Tracking chromatin looping dynamics using Super-Resolution Live-Cell Imaging
|
Chromatin looping connect the structure and function of the human genome. Human genes are often regulated by distal enhancer elements, which can in some cases be several millions of basepairs away from the gene they regulate, yet the enhancer must somehow loop and contact its target gene to regulate its expression. However, despite the fact that human enhancers were discovered in 1981 and the fact that ~90% of genetic variants that correlate with human traits and disease map to enhancer and non-coding regions, we still do not mechanistically understand how enhancers interact with their target genes (see Figure 1 in this review for a discussion).
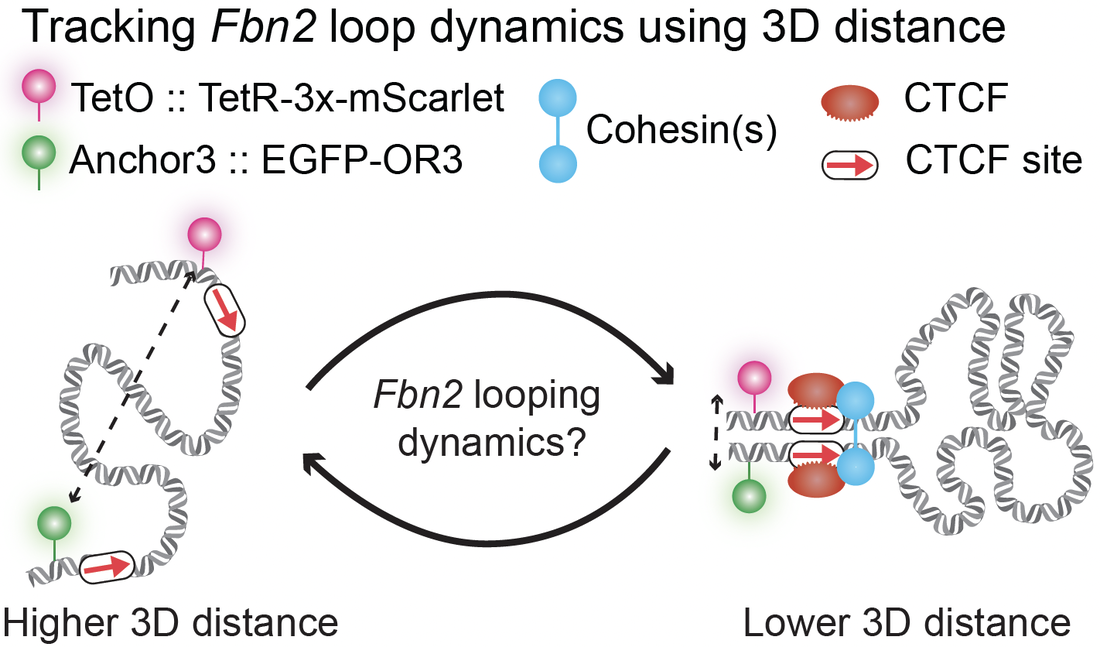
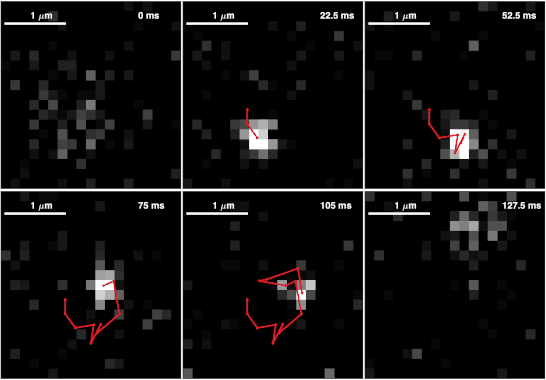
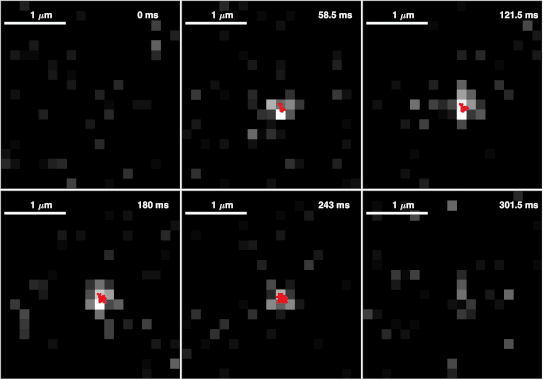
Beyond functional loops between enhancers and promoters, the proteins CTCF and cohesin fold the genome into structural loops that form domains called either TADs or Loop Domains. These domains play key roles regulating gene expression, DNA repair, and recombination. We are developing integrated experimental and computational methods for tracking chromatin looping in living cells using Super-Resolution Live-Cell Imaging (SRLCI), and recently visualized a CTCF/cohesin loop in living cells for the first time. As shown on the right, by putting green and magenta fluorescent labels near the two CTCF sites of the Fbn2 loop, we can track the labeled locations with very high spatiotemporal precision and use 3D distance to track loop status. Below are shown a zoomed out video of a full mESC colony and an example of tracking a single trajectory |
|
|
|
At the same time, we have developed new computational methods to analyze the resulting trajectories and infer when there is 'looping' in the trajectories. We call our method Bayesian Inference of Looping Dynamics, or BILD.
Through this integrated approach, where we use genome-editing to label loci of interest, Super-Resolution Live-Cell Imaging (SRLCI) to track chromatin looping in living cells, and BILD to infer when looping takes place and correlating it with downstream functional outputs, we can now both visualize chromatin looping in living cells, perturb it to understand it, and understand how looping regulates downstream functional outputs.
We have several ongoing projects on both improving these existing methods for tracking chromatin looping as well as to apply our approach to understand chromatin looping in development and disease.
We have several ongoing projects on both improving these existing methods for tracking chromatin looping as well as to apply our approach to understand chromatin looping in development and disease.
Spot-On
|
Single-Particle Tracking (SPT) is a powerful tool for elucidating the dynamics of proteins in live cells. We have developed an integrated experimental and computational approach to rigorous Single-Particle Tracking (SPT). Nuclear proteins can generally exist to two state: a mobile state (free diffusion; Left) and a relatively immobile state (e.g. bound to DNA/chromatin; Right). A key question is therefore: what fraction of the protein of interest is DNA-bound and what fraction is freely diffusing? And what are the characteristics of these subpopulations?
However, although powerful, 2D SPT of proteins inside a 3D nucleus is also subject to at least 4 biases: 1) tracking error; 2) motion-blur bias; 3) defocalization bias; 4) analysis bias. Some of biases are illustrated below: |
|
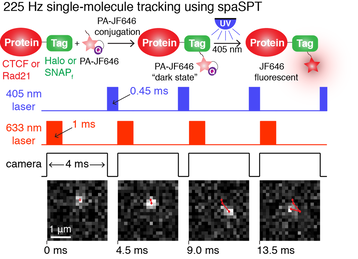
First, tracking at high particle densities (many in-focus molecules per frame) inevitably results in tracking errors (misconnections). This causes a big bias. With the introduction of bright, photo-activatable Janelia Fluor dyes (developed by Luke Lavis), this can be circumvented as shown on the right. We can image one molecule at a time and then, when it bleaches after a few frames, photo-activate the next one. This way, we can image at densities <1 molecule in focus per frame, which largely prevents tracking errors, but still generate tens of thousands of trajectories per cell. This concept is sketched on the right.
Second, SPT can suffer from 'motion-blur' bias. If you take a picture of an immobile object, you get a sharp picture. If you take a picture of a fast-moving object, you get a blur. The same is true in SPT. This means that detecting fast-diffusing proteins is much more challenging and leads to undercounting of fast-moving molecules. This causes bias. A solution is to strobe the excitation laser. We found that 1 ms excitation pulses effectively eliminate motion-blur even for nuclear proteins diffusing at ~10-15 um^2/s. Although this requires a powerful excitation laser, it effectively eliminates motion-blur bias. We call this integrated SPT approach stroboscopic photo-activation SPT (spaSPT), since it integrates the two previously described concepts of stroboscopic excitation (Elf, 2007) and photo-activation (sptPALM; Manley, 2008). |
However, even if spaSPT can correct most experimental biases, there are still analysis biases to be dealt with. Most notably 'defocalization bias'. This is illustrated in the SPT experiment simulation movie shown above (red slice is focal plane). As can be seen, DNA-bound molecules remain in focus until they bleach, but freely diffusing particles rapidly move out-of-focus. This means that DNA-bound proteins give long trajectories, whereas diffusing proteins give short trajectories and biases the analysis. However, the probability of defocalization can be calculated explicitly. Building on a previous framework by Mazza, we therefore developed Spot-On. Spot-On is a modeling framework for analyzing SPT data available as a drag-n-drop website, as MATLAB package or in Python. The basic work flow is shown below. You upload your raw SPT trajectories. Histograms of displacements at multiple timelags are then compiled and displayed. After this, you can fit a model to the data (e.g. 1 Bound and 1 Free state; 1 Bound and 2 Free states) and determine the diffusion coefficients of each subpopulation and their relative sizes (e.g. 30% bound to DNA), as well as the localization error.
There are many other commonly used tools for this kind of analysis. How well does Spot-On do? We performed an extensive benchmarking analysis in the associated paper and found 2 key take-aways. First, Spot-On outperforms all other available methods and accurately and robustly infers the key parameters when tested against experimentally realistic simulated SPT data, where the ground truth is known. Second, popular MSD-based methods perform very poorly, and should be avoided.
We extensively tested Spot-On under a number of conditions and situations: e.g. only about 1000-3000 trajectories are required for reasonably accurate analysis and Spot-On can infer the localization error with ~1 nm precision as long as there is a significant (>25%) bound population. Full details are given in the 23 supplementary figures associated with the paper.
What Spot-On cannot do, is single-trajectory analysis (e.g. identifying bound and free segments of individual trajectories). For this purpose, vbSPT or HMM-Bayes are better suited. Spot-On also currently models motion as Brownian motion. We are currently interested in extending Spot-On to different types of anomalous diffusion, since it is becoming increasingly clear that most nuclear proteins exhibit some form of anomalous diffusion.
Spot-On is available as a drag-and-drop website. No coding required. Just upload your data to spoton.berkeley.edu and perform all the analysis in your browser and download publication quality figures at the end:
The website also comes with an extensive documentation and full mathematical details on the underlying model as well as a tutorial, where you can use our raw spaSPT data as an example to explore how it all works. The MATLAB and Python versions of Spot-On are available on GitLab:
- Spot-On MATLAB: https://gitlab.com/tjian-darzacq-lab/spot-on-matlab
- Spot-On Python: https://gitlab.com/tjian-darzacq-lab/Spot-On-cli
Hansen, Anders S., Maxime Woringer, Jonathan B. Grimm, Luke D. Lavis, Robert Tjian, and Xavier Darzacq. "Robust model-based analysis of single-particle tracking experiments with Spot-On." Elife 7 (2018): e33125.
Quantifying absolute protein abundances (# proteins/cell)
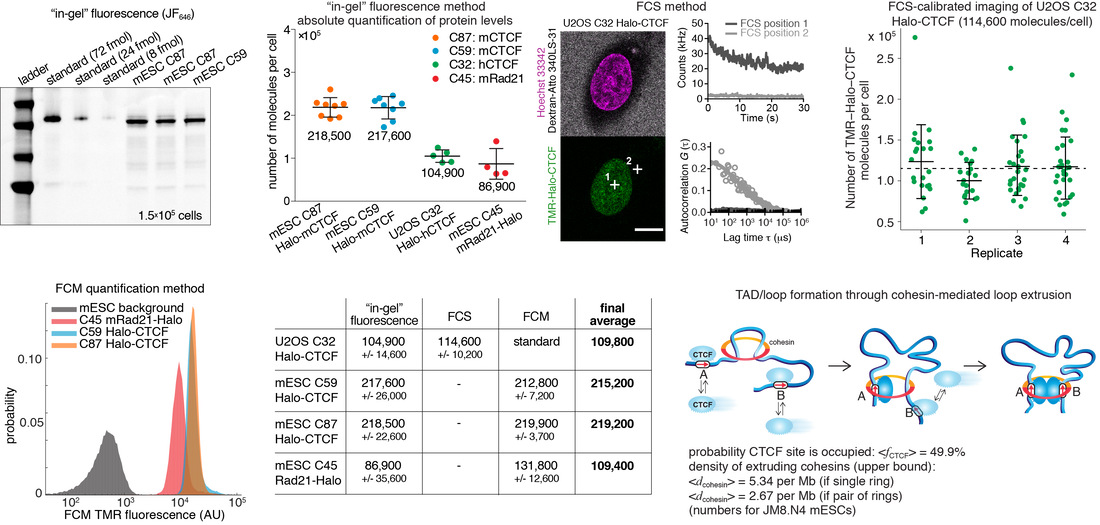
To achieve a quantitative understanding of the cell, it is necessary to know the absolute abundance of the proteins or factors of interest. However, it is surprisingly uncommon that we know the absolute abundance of a protein, i.e. number of proteins per cell. This is partly because measuring absolute abundances is inconvenient, cumbersome and labor-intensive. We therefore developed a simple FACS-based method for determining the absolute abundances of proteins. First, we determined the absolute abundance of CTCF and cohesin (through the Rad21 sub-unit) in human U2OS cells and mouse embryonic stem cells (mESCs) using 3 orthogonal methods: an 'in-gel fluorescence' assay, FCS-calibrated quantiative imaging and Flow Cytometry. This is shown below:
From this we determined that an 'average' stem cell (mESC) contains ~217,200 CTCF proteins and ~109,400 cohesin complexes (or, at least, Rad21 proteins). Similarly, an 'average' U2OS cell contains ~109,800 CTCF proteins corresponding to a nuclear concentration of ~144 nM.
To illustrate how absolute abundances can give real biological insight, we were able to constrain and parameterize the loop extrusion model using these numbers when combined with our previous estimates of the specifically bound fractions (~49% for CTCF and ~40% for cohesin), and the number of binding sites estimated by ChIP-Seq (~71,200 for CTCF in mESCs). Thus, we can calculate that the time-averaged occupancy of an 'average' CTCF binding site by CTCF is ~49.9%. Similarly, we can calculate an upper bound on the density of putative loop extruding cohesin complexes: ~5.34 per Mb (if a single ring) and ~2.67 per Mb (if dimeric).
To illustrate how absolute abundances can give real biological insight, we were able to constrain and parameterize the loop extrusion model using these numbers when combined with our previous estimates of the specifically bound fractions (~49% for CTCF and ~40% for cohesin), and the number of binding sites estimated by ChIP-Seq (~71,200 for CTCF in mESCs). Thus, we can calculate that the time-averaged occupancy of an 'average' CTCF binding site by CTCF is ~49.9%. Similarly, we can calculate an upper bound on the density of putative loop extruding cohesin complexes: ~5.34 per Mb (if a single ring) and ~2.67 per Mb (if dimeric).
|
Now that these cell lines have been quantified and cross-validated through several independent methods, they can be used as a standard. If you endogenously HaloTag your protein of interest and grow and label it side-by-side with e.g. the U2OS C32 Halo-CTCF cell line, you can now determine the absolute abundance of your protein of interest using Flow Cytometry and compare the fluorescence ratios.
|
Thus, using this cell line standard, it is now possible to quickly and conveniently get the absolute abundance of any protein that is Halo-tagged. We will freely distribute the cell lines described above without any need for an MTA or other paperwork - just send us a Reagent request.
Cattoglio C; Pustova I; Walther N; Ho JJ; Hantsche-Grininger M; Inouye CJ; Hossain MJ; Dailey GM; Ellenberg J; Darzacq X; Tjian R; Hansen AS: Determining cellular CTCF and cohesin abundances to constrain 3D genome models. eLife 2019, 40164.
For a detailed protocol on how to carry about the absolute protein abundance quantification, please see the step-by-step Bio-Protocol written by Claudia Cattoglio.
Anisotropy
|
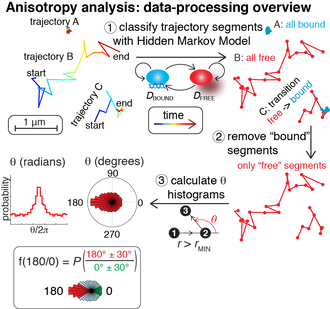
As part of our recent paper, we developed a computational pipeline for analyzing anomalous diffusion of nuclear proteins. Briefly, we use a Hidden Markov Model to classify trajectories into their free and bound components and then we analyze only the free segments of the trajectory and only displacements that are much, much longer than our localization uncertainty.
We then calculate the angles between consecutive displacements. Here, we found a backwards bias for wild-type CTCF, but not for certain mutants. A paper exploring the biological significance of these findings is available here. The raw code to reproduce our figures, but also to be applied for other proteins of interest, is available on GitLab:
|
Microfluidics
|
Building on a clever chemical genetic approach developed by Nan Hao, we developed a high-throughput microfludic platform for controlling the activation dynamics of the budding transcription factor, Msn2.
A small molecule, 1NMPP1, is used to inhibit a kinase (PKA), which causes Msn2 to translocate to the nucleus and activate target gene expression. By fluorescently tagging Msn2 and using fluorescent reporter genes, we can thus measure the input-output relationship between e.g. the amplitude or frequency of Msn2 activation and the gene expression output for different promoter architechtures. An example of a typical experiment is shown on the right. To make this setup easy to reproduce we published a detailed step-by-step protocol, which is available at Nature Protocols. |
|
Hansen, Anders S., Nan Hao, and Erin K. O'Shea. "High-throughput microfluidics to control and measure signaling dynamics in single yeast cells." Nature protocols 10.8 (2015): 1181.
